Insurance Risk Services
Fire, Flood, Wind, Hail, Realtime and Historical Weather, Distance-to-Shoreline, Closest Fire Stations, Earthquake, Crime.
Realtime and batch services. Or license the raw data and/or software.
Get Expert Advice on Insurance Risk Services
Profitability Requires Accuracy and Quality
SpatialPoint supplies key technologies that are often used in the insurance industry. Company profitability hinges on the accuracy of risk assessments and proximity and location attributes are key factors in these assessments. These tools can be used in underwriting, to create a single view of risk, be foundational in usage-based insurance applications and in fraud detection.
Underwriting, Operations and Analytics
In commercial, industrial, and residential underwriting, accurate and robust risk and property data is essential to effectively doing business and performing analytics. Risk changes because hazards and perils change, rules change, the area around locations change and aggregate risk changes.
24 of the top 25 Property And Casualty Insurance Companies use one or more of these products.

Profitability Requires Accuracy and Quality
SpatialPoint supplies key technologies that are often used in the insurance industry. Company profitability hinges on the accuracy of risk assessments and proximity and location attributes are key factors in these assessments. These tools can be used in underwriting, to create a single view of risk, be foundational in usage-based insurance applications and in fraud detection.
Underwriting, Operations and Analytics
In commercial, industrial, and residential underwriting, accurate and robust risk and property data is essential to effectively doing business and performing analytics. Risk changes because hazards and perils change, rules change, the area around locations change and aggregate risk changes.
1. Wildfire Risk, Property Fire Risk, Distance to Fire Station, Hydrant Coverage

Fire Risk Pro provides an up-to-date, scientific model to accurately capture the inherent wildfire risk for every location across the US. Many variables are included, including predicted severity (hazard) and predicted frequency (risk) of wildfire at a given location. Three components are available: Fire Risk Model, Fire Perimeter and Mountain Pine Beetle Presence (which are capable of killing a tree in two to four weeks.)
- Modeling reflects the landscape, topology, slope, vegetation, etc. of every area.
- Modeling accounts for fire shed risk outside their boundaries – e.g. a meadow surrounded by volatile timber.
- Landscape is divided by relative amounts of built environment vs pure wildland fuels – Wildlands, Intermix and Interface areas. For each risk-area type, many variables are included to describe these areas, burn potential, suppression capabilities, etc
The potential for wildfire exposure is a growing hazard as temperatures rise, wildland fuels accumulate, and people continue to build structures in areas of elevated wildfire risk.
Additionally, Fire Station and Hydrant Coverage is available:
- Fire hydrant coverage for properties in municipal areas
- Driving distance to the three closest fire stations
- AM, PM and off-peak drive times (in minutes) to the three closest fire stations
2. Flood Risk

Flood Risk provides the most current flood mapping data from the Federal Emergency Management Agency (FEMA). In addition to flood zone information, the product includes a database of community participation status in the National Flood Insurance Program (NFIP), elevation profiles, and proximity measurements to varying levels of flood risk.
- Determine the flood zone, community participation status, and LOMR information for any property in the U.S.
- Assess flood risk exposure and accurately calculate premiums with respect to a distribution policyholders
- Determine flood zone elevation and whether or not a property qualifies for the National Flood Insurance Program (NFIP)
- Augment edge case risk assessments by understanding a property’s distance to 100 year and special hazard flood zones
- Identify the nearest water body to a particular property and view the elevation profile between the property location and the water body
- Available as a geoenriched file which appends all flood risk information to every affected address location using a unique identifier, as well as proximity measurements for added insight at the address level.
3. Earth Risk (Earthquakes, Soil, Sinkholes, California Probable Maximum Loss(PML, etc.)

Earth Risk provides nationwide coverage of land related risks including earthquakes, landslides, lava flows, sinkholes, and hazardous soils to help stakeholders understand risk by geography.
Data layers are digital representations sourced from the United States Geological Survey (USGS), the National Earthquake Information Center (NEIC), the Earthquake Hazards Program, and AMLIS (Abandoned Mine Land Inventory System).
- Determine proximity to high susceptibility regions for mass movement events
- Assign landslide risk, earthquake risk, and soil related risk exposure to property locations during the underwriting process
- Analyze earthquake data across an insured network to calculate geographic risk exposure, customer insurability, and probable maximum loss
- Locate a property’s proximity to the nearest fault
Details:
4. Distance to Coastline

Distance to Shoreline (or Shore, Coast or Coastline) calculates the the straight-line distance from a property (actually, coordinates) to the Shoreline.
- Understand the risks associated with storms, hurricanes, unexpected tidal events, etc.
- Comply with various governmental regulations for properties that are close to coastlines
- Evaluate your entire book of business and calculate concentrations of aggregated shoreline/coastal risks
- Offered as a service, on-premise/self-hosted or we license the raw data
5. Historical Weather Risk

Historical Weather Risk contains comprehensive, historical records of hazardous weather data including hurricane, hail, tornado, and windstorm events. Each weather hazard contains attribution about the date and the severity of the event.
(See Dynamic Weather, below, for live weather)
Wind events use the Beaufort Wind scale, tornadoes use the Fujita-Pearson scale, hail events use the TORRO intensity scale, and hurricane events reference the Saffir-Simpson scale. Additional attribution including magnitudes, fatalities, injuries, crop/property damages, and other meteorological details are provided as available.
- Understand the risks associated with storms, hurricanes, unexpected tidal events, etc.
- Comply with various governmental regulations for properties that are close to coastlines
- Evaluate your entire book of business and calculate concentrations of aggregated shoreline/coastal risks
- Offered as a service, on-premise/self-hosted or we license the raw data
Features
- Contains historical records of tornadoes, windstorms, hailstorms, and hurricanes from 1995 – present
- Includes a grid that aggregates the counts and intensity of historical weather events across the U.S.
- Each type of weather hazard contains a qualitative rating system derived from quantitative facts to easily compare severities across regions
- Provides ranges or contours of qualitative ratings to further identify risk distributions
- Includes a geo-enrichment file which appends historical weather risk information to every affected address location using a unique identifier
6. Dynamic Weather

Dynamic Weather provides users with historical, real-time, and forecasted weather data at a hyper-local level for greater context in decision-making.
The offering, which is API-based, provides customers with maximum accuracy, consistency, and context in data, which are the essential elements of data integrity. Dynamic Weather delivers weather information at specific locations by revealing patterns related to rainfall, hail, wind, temperature and more for a variety of use cases across industry sectors.
(Also see Historical Weather, above)
While most weather services allow users to visualize areas on a regional level, Dynamic Weather has the ability to drill down to the minute at a radius of just half a mile. This enables users to see how extreme weather conditions – like hail, wind, rain, or snow – impact specific properties or routes. Industry applications:
- Insurance: Dynamic Weather allows insurers to combat insurance fraud by determining whether adverse weather patterns actually impacted and destroyed specific properties. It also allows insurers to track trends in severe weather systems (such as tornadoes and hurricanes) to better set rates.
- Retail: Retailers can use Dynamic Weather to compare and correlate past weather events to sales to make informed inventory predictions ahead of similar scenarios. For example, if a retailer knows that a specific store location sold 30% more air-conditioning units during a heat wave, they can replenish supply accordingly ahead of a predicted heat wave.
- Logistics: Dynamic Weather gives businesses visibility on the weather status across the supply chain. Businesses can see how weather patterns may affect the departing location, route, or final destination of an item and ultimately the delivery of a product. This level of insight allows businesses to more accurately provide updates to customers on shipping delays.
Features
- Built from API that calls data within 5 minute intervals
- Aligns weather data to a 1 kilometer geohash
- Links geohash ID to all specified locations within a grid cell to deliver weather data
- Converts raster data to vector format while retaining all pixel values
- Includes unique address identifier
- Includes customizable alerting mechanisms
- Integrates with Spectrum Spatial Risk Analyzer to offer complete risk picture
7. Crime Data

The Crime dataset includes aggregated and summarized crime data built to work in conjunction with the various boundary products (ZIP Codes, Census Tracts, Block Groups, Carrier Routes, etc.)This data allows businesses and consumers to quickly understand the safety, and potential impact on the desirability, of a neighborhood or region. A total of 11 crime types are included with three breakdowns: Overall, Violent and Property.
1. Overall Crime
2. Violent Crime Score
3. Murder
4.Rape
5. Robbery
6. Aggravated Assault
7. Property Crime Score
8. Burglary
9. Larceny-Theft
10. Motor Vehicle Theft
11. Arson
Crime data is an importanmt component in many different industries.
- Insurance companies use crime data in actuarial models to help in underwriting
- Retailers use Crime data in site selection and operational activities.
- Banks use crime data to assess lending risks in for commerical, residential and industrial loans.
- Real estate professioanls use crime data to help their customers.
- Government agencies use Crime data to help provide services to the public.
Consistency and Quality Are Important
It should be emphasized that consistency and quality are important for many applications, especially for where the data is used downstream and in data science, predictive analytics and big data applications.
Geographic Coverage:
Reverse Geocoding is available for 150 countries at the Street Level or better (parcel or building) and a total of 250 countries at varying levels of resolution.
Deployment Options:
- As a web service for instant responses
- As a web service for batching many records at once
- As a portal/cloud-based application where you can manually upload files for processing. MapMarker.
- As part of the Spectrum, Precisely’s premier Platform for Enterprise Geocoding, Data Quality, Data Management and Data Governance. system
- We also license the raw data for your own processing. Datasets include:
• Raw street databases with address information and dozens of layers of geographic features, points of interest, etc. (Available for many countries)
• Address Fabric – which is a point database of every address in the US, including hard-to-find addresses that are not deliverable by the USPS.
• Parcel boundaries with many attributes, including links to assessor information.
• Vast Points of Interest databases
• Many boundary databases such as schools, neighborhoods, postal boundaries, world country boundaries, wireless coverage boundaries, etc.
You are on the Insurance Risk Services Page in the Software-as-a-Service (SaaS) Section…
More from our Blog
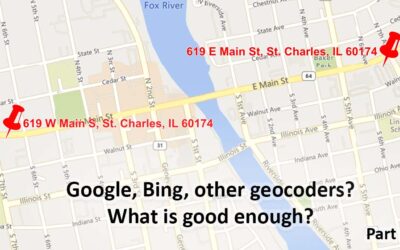
Geocoding – Are Google, Bing, etc. Good Enough? Part 1
Are the geocoding tools in Google, Bing, etc. good Enough? Part 1 Note: This is the first of a series of articles contrasting the approach of many geocoders, especially Google's and Bing's offerings, with enterprise/professional geocoding. When Google introduced...
Geocoding Basics
Geocoding Basics What is geocoding? Simply, it’s the process of matching a location such as: an address ("Street-level geocoding") postal (ZIP) code ("ZIP-Level or Postal-Level geocoding) city name ("City-Level Geocoding, not used as much anymore) county name,...
Introducing the Signal And Noise Blog – Topics Include Mapping, Spatial, Geocoding, Address Correction, Geographic Data
One of our goals in communicating to you is to provide the most important information that helps you identify the signal and the noise. Think of listening to a radio station with static. The static is the noise and the voices or music are the signal. Our brains do a great job of filtering audio and there are tools to draw out the signal and suppress the noise. This blog is about focusing on the signal for various topics and, when possible, we’ll describe the noise. Unlike the radio static that is random, some of the noise in the marketplace may seem like signal, but it’s not.